


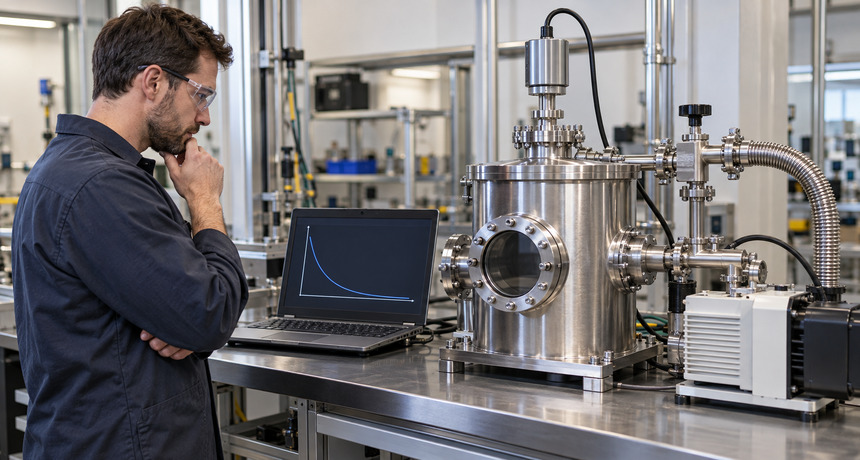
Reading a Pump-Down Curve to Separate Leaks from Outgassing
A pump-down curve is more than a record of how long a chamber takes to reach pressure. Plotted as pressure against elapsed time—usually with pressure on a logarithmic scale—it becomes a diagnostic fingerprint. A healthy system produces a repeatable shape. When that shape changes, the curve can show whether the system is simply removing its initial gas volume, fighting a restricted pumping path, approaching a steady leak load, or slowly clearing gas released from internal surfaces.
The curve cannot identify a leak location or name a contaminant by itself. It can, however, keep a troubleshooting team from replacing a pump when the real problem is a wet chamber, a loaded fixture, a partly closed valve, or a seal that admits air. The best results come from treating pressure-versus-time data as controlled evidence rather than a single pass-or-fail number.
Begin with a repeatable baseline
Record a baseline when the system is known to be clean, tight, and operating normally. Use the same starting pressure, chamber configuration, valve sequence, pump temperature, and gauge location each time. Note whether the chamber is empty or loaded, how long it has been open to room air, and whether it was recently washed, baked, or exposed to a wet process. Those details often explain more than the final pressure does.
Use instruments that cover the entire pressure path. The broad selection of vacuum gauges reflects the fact that no single sensing principle is equally useful from atmosphere into high vacuum. Pirani gauges are common through rough and medium vacuum, while cold-cathode gauges extend measurement into the high-vacuum region. For gas-independent process readings within their specified range, capacitance-diaphragm gauges can provide a valuable cross-check. Log the active gauge and crossover point so an apparent discontinuity is not mistaken for a system event.
Understand the shape before diagnosing it
In the simplest model, a sealed volume V evacuated by a constant effective pumping speed S follows an exponential pressure decline: p(t) = p₀e^(−St/V). Real systems depart from that ideal almost immediately. Pumping speed changes with pressure, conductance limits the speed delivered to the chamber, gauge response changes across ranges, and surfaces release gas as pressure falls. The curve therefore has regions, not one universal slope.
The early region is dominated by removal of the chamber’s free gas. A slow initial descent often points toward insufficient roughing speed, restricted plumbing, a closed or undersized valve, or a pump that is not at operating condition. The relationship between nominal pump speed, chamber volume, and cycle time is discussed in Properly Sizing a Vacuum System for Your Application. In a turbo system, a change in backing conditions may also alter the transition into high vacuum, making foreline pressure part of the same diagnosis.
Later in the cycle, the gas already in the volume matters less. Surface desorption, permeation, trapped pockets, process residue, and real leaks make up a growing share of the load. The curve flattens because the pump is now balancing gas that continues to enter the chamber. That transition is expected; the question is whether the late-time load declines, stays constant, or responds to changes in temperature and exposure history.
How leaks and outgassing differ on the curve
A real leak often behaves approximately like a constant gas throughput. Once the transient surface load falls, the chamber approaches a plateau near p = Q/S, where Q is incoming gas load and S is effective pumping speed at the chamber. A repeatable plateau at nearly the same pressure can therefore support the leak hypothesis, especially when it appears abruptly after service or a seal disturbance.
Outgassing is usually time dependent. Water adsorbed on chamber walls, solvents in residue, and gas dissolved in polymers are released progressively. The late portion of the pump-down continues to fall, but more slowly than the ideal volume-removal line. A second pump-down performed after the chamber remains under vacuum often improves because much of the readily released material has already left. Warm surfaces may initially release more gas, yet controlled heating can shorten the total cleanup by accelerating desorption while the pump is operating.
The distinction is not absolute. A virtual leak from a blind tapped hole or trapped volume may release gas slowly enough to resemble outgassing. Permeation through elastomers can behave more steadily. A wet oil-sealed pump can also delay recovery; the operating tradeoffs described in How Gas Ballast Changes Pump-Down and Vapor Handling help explain why chamber history and pump condition must be logged together.
Use a rate-of-rise test to strengthen the diagnosis
A rate-of-rise test separates the chamber from the pump and measures how pressure changes with time. After reaching a stable low pressure, close the isolation valve, wait for immediate transients to settle, and record pressure at consistent intervals. For a chamber of known volume, the total gas load is approximately Q = V(Δp/Δt). The result includes real leakage, outgassing, permeation, gauge effects, and any gas released from isolated plumbing.
A persistent, nearly linear rise that repeats after additional pumping supports a steady leak load. A rise that becomes progressively slower on repeated tests points more strongly toward desorption or another diminishing source. Accurate isolation matters: leaking or poorly positioned vacuum valves can become part of the measured load. Confirm that clamps, centering rings, and seals in the relevant KF flange connections are assembled correctly before interpreting the slope.
A practical troubleshooting sequence
- Overlay the new curve on a known-good baseline. Compare the first deviation, not only the final pressure. A change beginning at atmosphere suggests a different problem than one that appears only after high-vacuum crossover.
- Verify the measurement chain. Confirm the correct gauge is active, check zero or calibration status, and consider gas-species sensitivity. A dirty sensor or range transition can create a false plateau.
- Check the pumping path. Confirm valve position, hose condition, conductance, pump temperature, and foreline performance. A restriction reduces effective speed and can make a tight chamber look gas-loaded.
- Repeat the pump-down under controlled conditions. Compare empty and loaded chambers, then compare the first and second cycles after extended pumping. Improvement with time supports an outgassing or moisture explanation.
- Perform a rate-of-rise test. Repeat it after more pumping or controlled warming. Look for a declining slope rather than relying on one isolated reading.
- Escalate a persistent leak signature with tracer gas. Helium leak detectors can locate and quantify small real leaks that a pump-down curve can only suggest. Use a deliberate test sequence so helium does not saturate the area or create confusing background.
Know what the curve cannot prove
A slow pump-down does not automatically mean the pump is worn, and a good blank-off test does not prove the complete system is clean or tight. Gauge location, conductance, chamber temperature, process hardware, and switching logic all influence the trace. If the chamber behaves normally with a substitute pump but the original unit cannot achieve its expected isolated pressure or pumping behavior, professional pump rebuild service may be appropriate. The curve helps define that decision; it does not replace model-specific service limits.
Conclusion
A useful pump-down curve records the conditions that produced it and shows where performance first departs from a healthy baseline. A steady late-time load and repeatable rate of rise support a real-leak diagnosis. Continued improvement with time, repeated cycles, or controlled heating points toward outgassing or trapped gas. Measurement errors and reduced effective pumping speed should be eliminated before either conclusion is accepted.
If your curve has changed, stalls at an unfamiliar pressure, or leaves you uncertain whether to inspect seals, gauges, valves, or the pump, contact the High Vac Depot team for help planning the next diagnostic step and selecting the right vacuum equipment for your system.






Leave a Reply
You must be logged in to post a comment.